by Support Support
- Last updated May 04, 2022
- Agricultural Irrigation, Water distribution
The Water Distribution Uniformity (DU & CU)
The uniformity coefficient (CU), an important parameter in the design of irrigation systems, significantly affects the quality and return on investment in irrigation projects, and is a good indicator of water losses.
Steps for data collection
1. Placing the sprinklers in such a way that the distance between sprinklers in the column & rows is equal (for example here it is 10 metre). So 9 rectangular areas- each defined by 4 sprinklers at its 4 corners.
2. Place catch can in equal distance between the axes
• 1 metre or less on both axes for sprinklers (flow rate ≥ 200 l/h)
• ½ metre or less on both axes for micro-sprinklers (flow rate < 200 l/h)
Note: all gauges should be identical and should be positioned at the same elevation.
3. The effect of wind on distribution uniformity is unpredictable. For accurate measurement, the system should not be operated under windy conditions.
4. The amount of water collected in each gauge or can is measured and the results (in millimetres) are recorded as a table from highest to lowest.
There are 3 methods for calculating distribution uniformity:
• Christiansen coefficient of uniformity (%CU)- known to produce the most flattering results
• Distribution uniformity (%DU)- known to be more rigorous than %CU
• Scheduling coefficient (SC)- known to be the most rigorous method of all
Christiansen Coefficient of Uniformity (%CU)
% CU is the measure of uniformity expressed as the average rate (%) of deviation from the overall average application.
For open field sprinkler irrigation, %CU of:
• 92% or higher- Excellent uniformity
• 88% to 92%- Very good uniformity
• 86% to 88%- Good uniformity
• Lower than 86%- Acceptable for certain low-value crops only
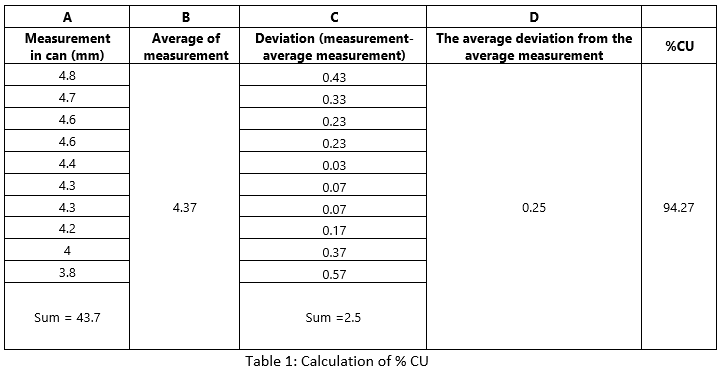
Sample calculation of %CU
For example, we are placing 10 cans between that sprinkler area, after one hour note the readings
1. The level of water in each can is noted as A
2. All the numbers in the A column are summed up and found the average value (B)
3. Noted down deviation from the average value (C). note: deviation is noted only in a positive number
4. Summing up all deviation value
5. The sum is divided by the number of gauges/cans placed in the field. This provides the average deviation from the average measurement. (D)
So, %CU= {1 – (Average deviation from average measurement / Average of measurement)} x 100
= {1 – (D/A) = 1 – (0.25/.37)} x 100 = 94.27%
So, %CU = 94.27% |
Distribution uniformity (%DU)
% DU is a measure of uniformity, with the dry 25% of the surveyed area as a percentage of the total average net application.
So, % DU= 93.3% |
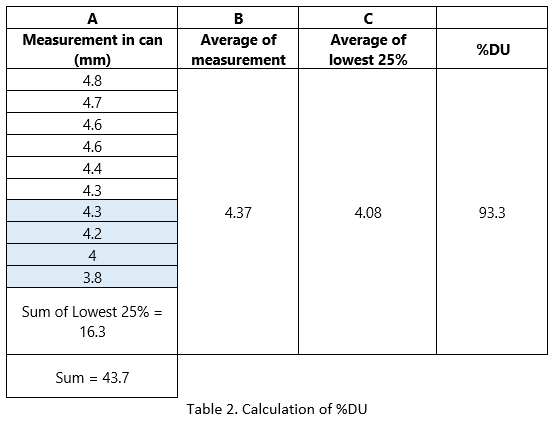
Advantage of the %DU method:
The %DU measurement takes into account the driest results. Therefore, it is better than% CU because it compares the area with the lowest water availability to the average application of the whole area.