How to Generate and Read a Centrifugal Pump Curve
A blog on how to generate and read a centrifugal pump curve.
The pump curve is a graphical representation of the performance of a pump formulated on a test performed by the manufacturer. Each pump has its own pump performance curve, which varies from pump to pump. It is based on the horsepower of the pump and the size and shape of the impeller.
Pump Curve Essentials
Discharge/Flow rate
The flow rate is a measurement of how much liquid is flowing from the pump in a given amount of time. This measurement comes in many different units such as gallons per minute, litres per second, or cubic meters per hour.
Head/Pressure
The term head is often used to describe the pressure exerted by a pump, but the measurement is often given in terms of feet or meters. This is because the height to which a pump can push the liquid directly correlates with the pressure exerted and is a much more meaningful metric for a pump. Another reason is that the pressure exerted by the pump will vary depending on the liquid used. However, the height to which the pump can move the liquid will remain the same.
For example, we have a pump that can provide 40 meters of the head. If we use it to pump water (Specific gravity 1), the pressure will be around 4 bar. But if we were to use it to pump milk (specific gravity 1.035), then the pressure will be around 4.2 Bar.
Efficiency of Pump
The efficiency is the ratio or comparison between the amount of energy going into the pump versus the amount of energy we get out of the pump. So ideally, we want this to be as close as possible to for optimal performance.
The pump would always lose some power when it converts and transmits this electrical energy into mechanical energy. And this will be lost through the couplings, the bearings, the shaft, the seals, the cooling fan, etc.
How is the performance curve generated and what did represent?
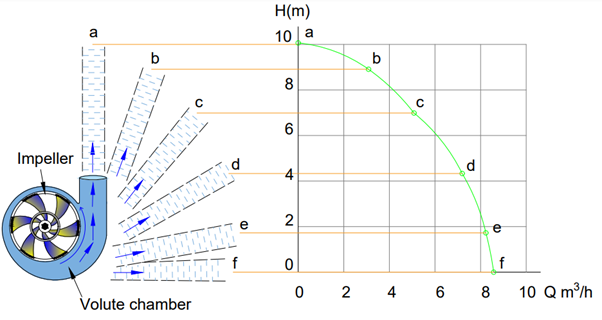
The performance curve is sometimes referred to as the HQ curve. The H stands for head, and Q represents flow. The pump manufacturer will test the pump to get the performance data and plot this on the graph. The graph represents all the possible configurations between the flow and the head pressure and is used to see whether a pump will suit our requirements. The performance curve is going to be different for every pump and a few will suit our system. Generally, you’ll notice that as the pump flow increases, the head pressure decreases. When selecting a circulating pump, the pump will only perform as per the curve path.

Fig:1 Construction of a pump curve
How to find best operating region of a pump
AOR and POR
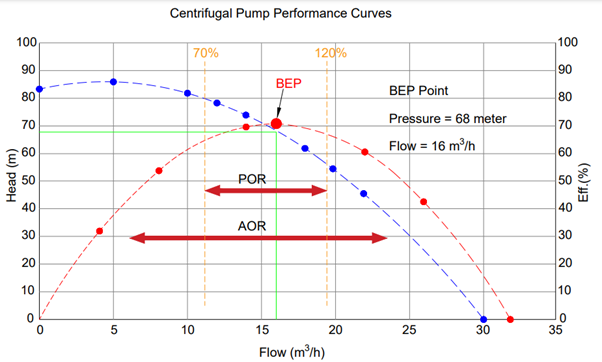
The Allowable Operating Range, or AOR, is a portion of the pump curve determined by the pump manufacturer to be safe enough for the pump to operate without significantly affecting its performance or life span. Working beyond AOR is not recommended.
The Preferred Operating Range (POR) is a narrow area within the border of AOR where the pump exhibits excellent efficiency and reliability. This region typically ranges from 70 to 120% of the best efficiency point (BEP).

Fig 2: AOR. POR & BEP point of a pump curve
How to keep your pump operating near its Best Efficiency Point (BEP)
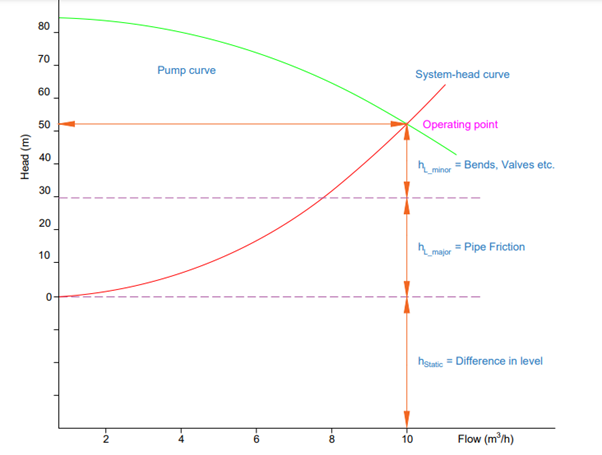
First, locate your pump performance curve and system curve and identify your operating point. The pump manufacturer will give you the pump curve, but your system curve is determined by you. It represents the flow rate variation relative to the total system head loss.

Fig 3: Operating point
Ensuring that each pump in the system operates as close as possible to its BEP is an important factor in achieving optimal overall system performance. Not only will this give you a better return on your energy dollars but doing so will also reduce your maintenance costs. The pumps operate most smoothly and have the longest service life when operating close to their BEP.
For selecting pump at its BEP have a look at pump selection tool KHS.
If you would like to check the performance of your system or have further questions, feel free to contact us. We have built our business to help customers like you get the most out of their systems.


.png)


Comments (10)